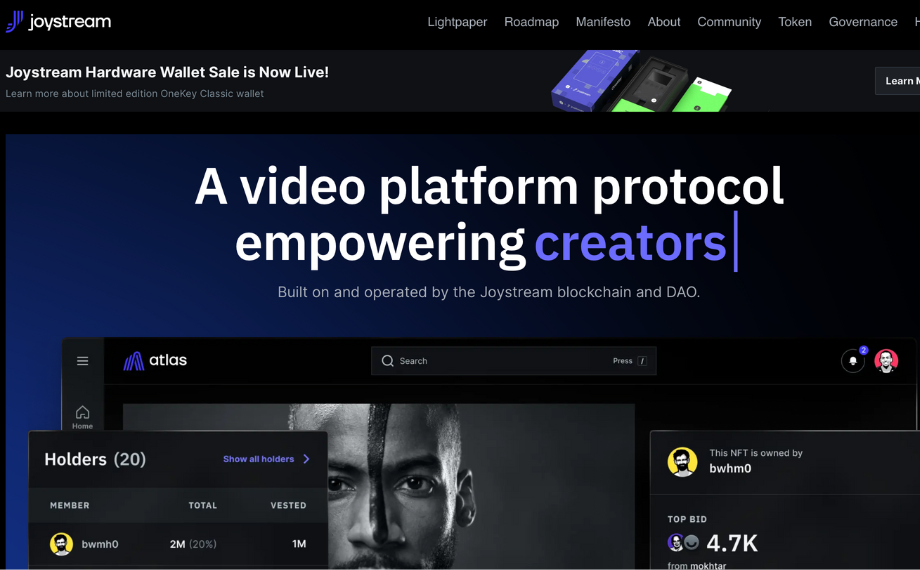

About project
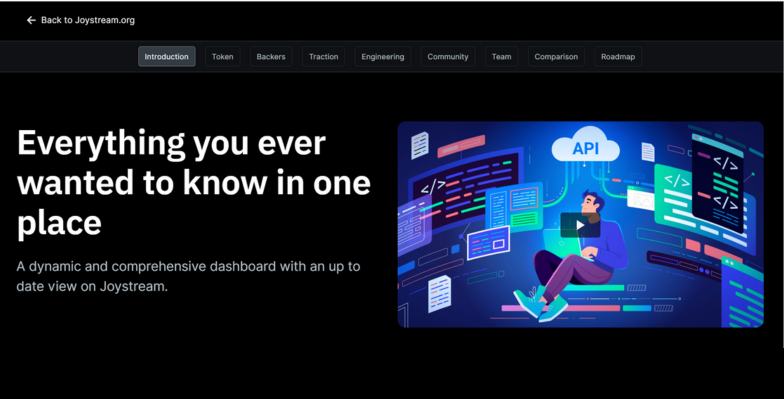
The Joystream dashboard offers a comprehensive overview of essential company data and performance metrics, covering aspects such as tokens, supporters, progress, development, community engagement, team dynamics, comparative analysis, and future plans.
Duration
01.2024 – 03.2024
teCHNOLOGIES
Business solutions
- Direct Monetization: Joystream allows creators to earn directly from their content, bypassing middlemen.
- Community Governance: Users have a voice in platform decisions, promoting a decentralized approach
- Automated Transactions: Smart contracts handle transactions and revenue sharing efficiently, ensuring transparency.
- Personalized Discovery: Advanced algorithms tailor content recommendations for users, boosting engagement
- Strong Privacy: Joystream prioritizes user privacy with decentralized storage and encryption, building trust.
deveLOPMENT PROCESS
- Orchestrated the development workflow by structuring pull requests in Git, complete with detailed comments to foster team comprehension and facilitate smooth review processes.
- Emphasized a responsive user interface to ensure a visually captivating and functional dashboard across various devices.
- Crafted semantic and accessible markup, enhancing user experience while bolstering SEO efforts.
- Adhered to the BEM methodology for styles, promoting clear naming conventions for efficient development.
- Leveraged Gatsby.js with server-side rendering for optimal initial page load speed and SEO advantages.
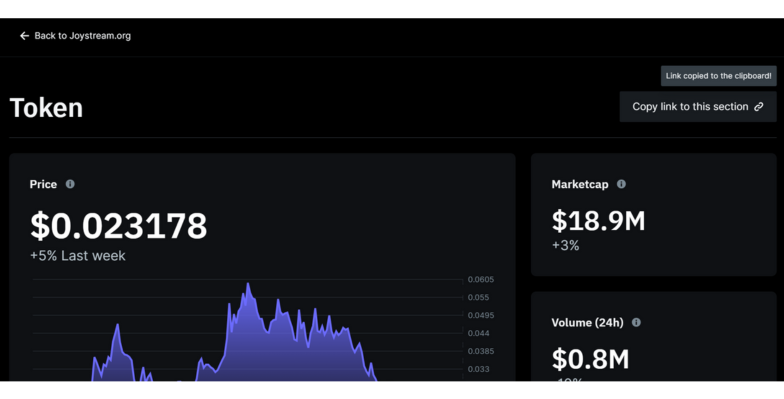
- Integrated APIs to ensure users have access to real-time information.
- Implemented internationalization (i18n) for a seamless user experience catering to a global audience.
Roadmap
Development Workflow & Responsive Design
● implemented a well-organized pull request system to promote efficient team collaboration;
● developed semantic and accessible markup, with stylesheets corresponding to the BEM naming convention, for header, hero, token, backers, traction, engineering, community, team, comparison, and roadmap sections.
API Integration and Internationalization
● established API integration to provide users with the most up-to-date information;
● introduced a visual loading state to indicate that data is being fetched;
● implemented internationalization (i18n) to support multiple languages to reach a global audience.
Main Functionality
Navigation System
Anchors: Clicking navigation links scrolls smoothly to sections.
Scroll Tracking: The navigation bar smoothly appears when scrolling up and hides when scrolling down, maintaining focus on content.
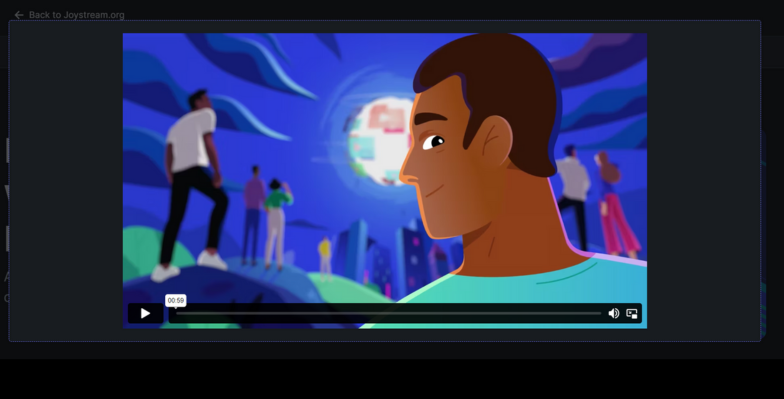
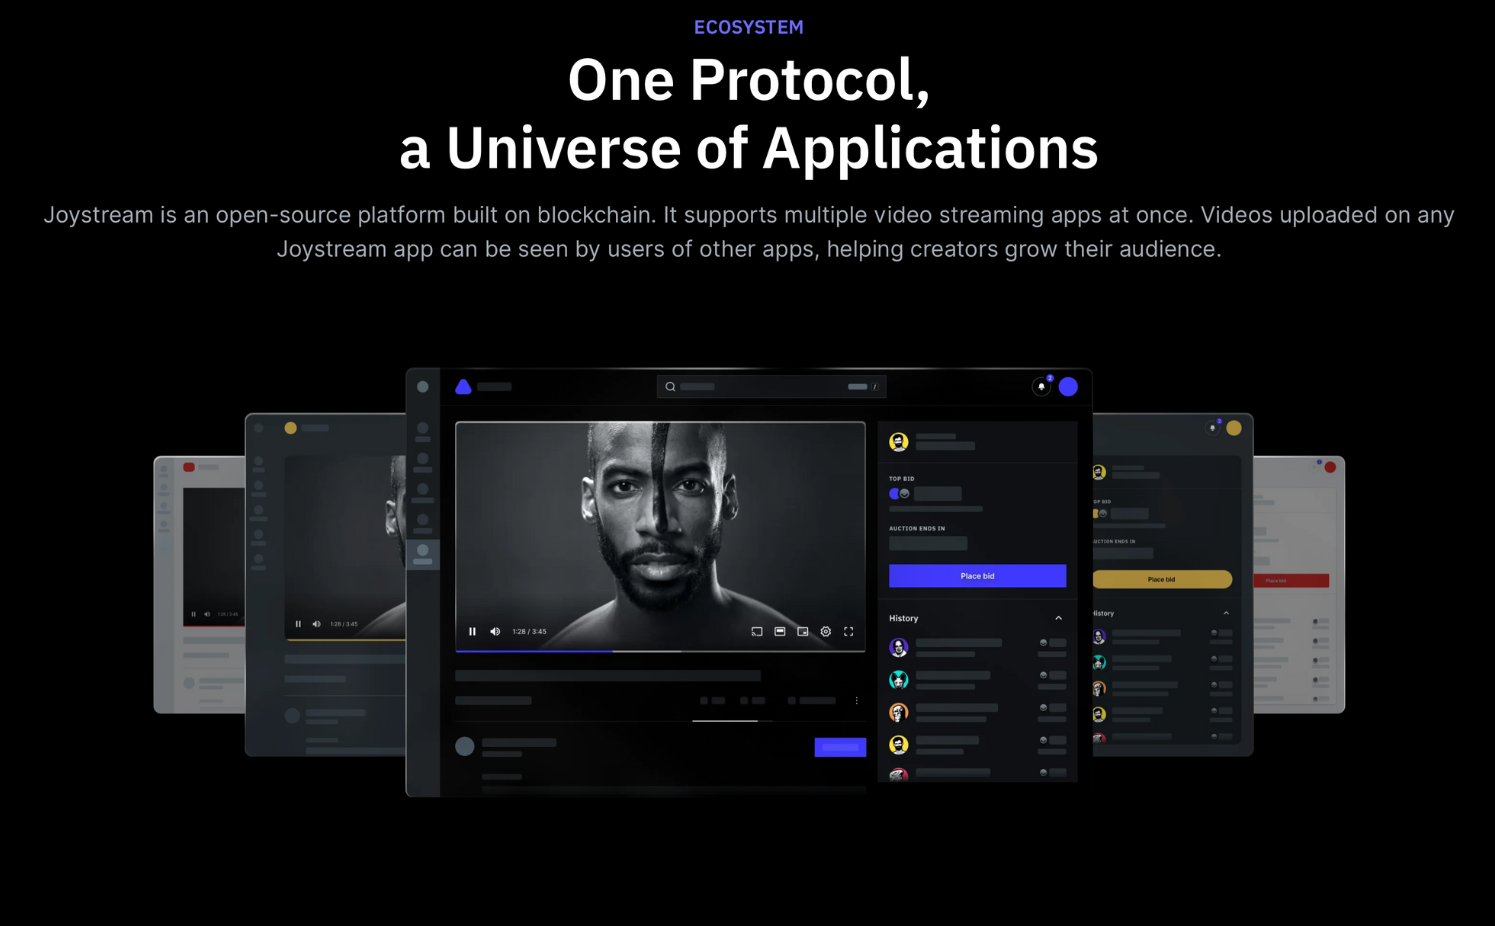
Video Player
Copy to Clipboard
Term Definition Tooltip
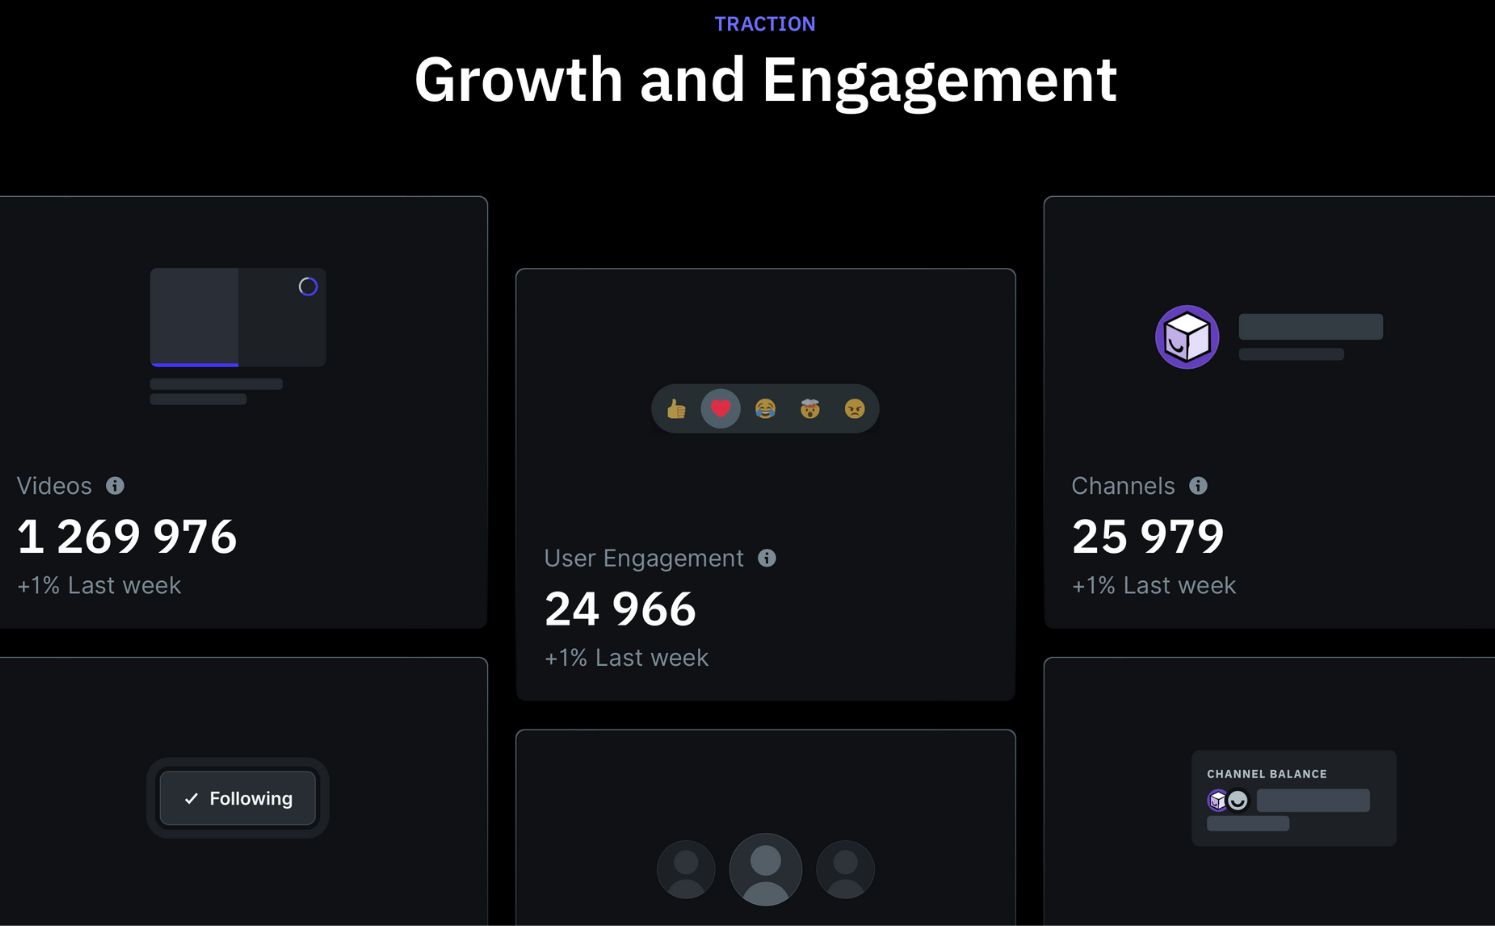
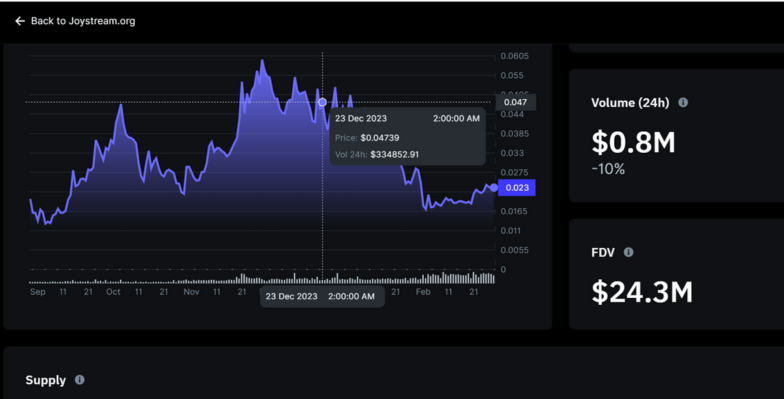
Composed Chart
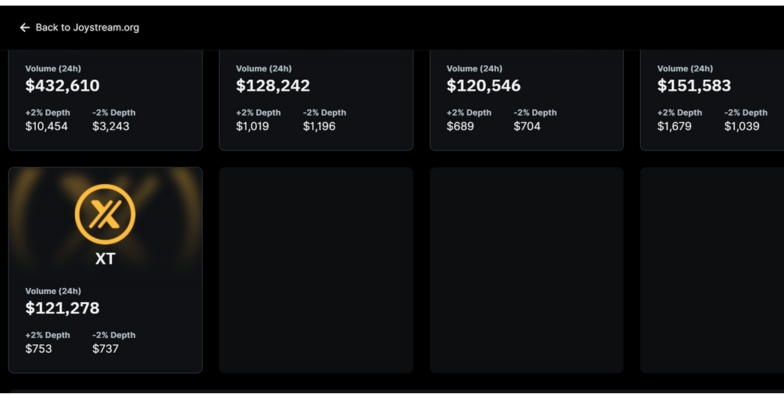
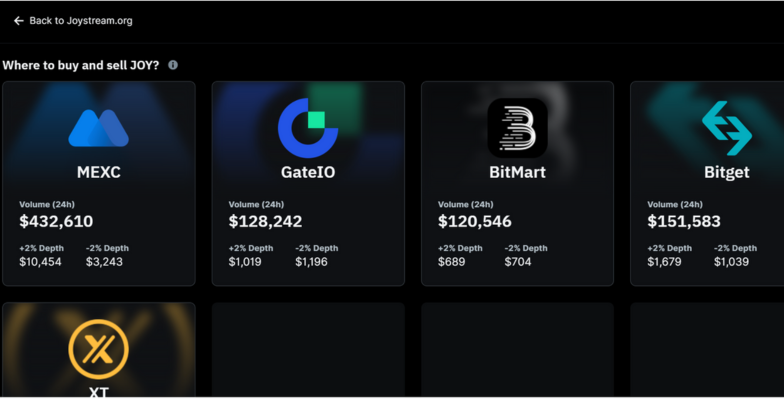
Grid Layout with Placeholder Handling
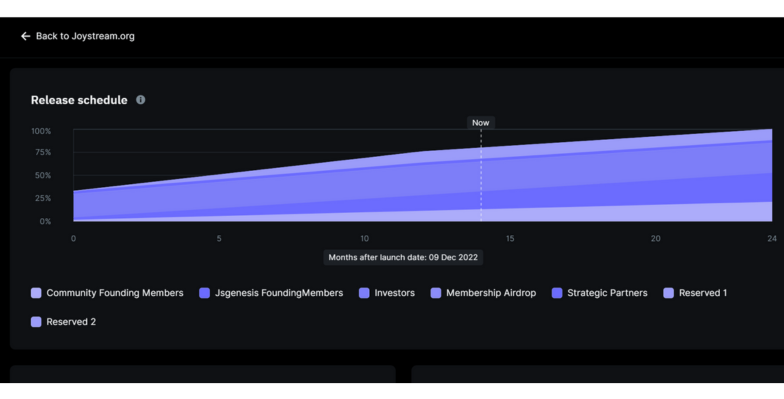
Area Chart with Interactive Legend
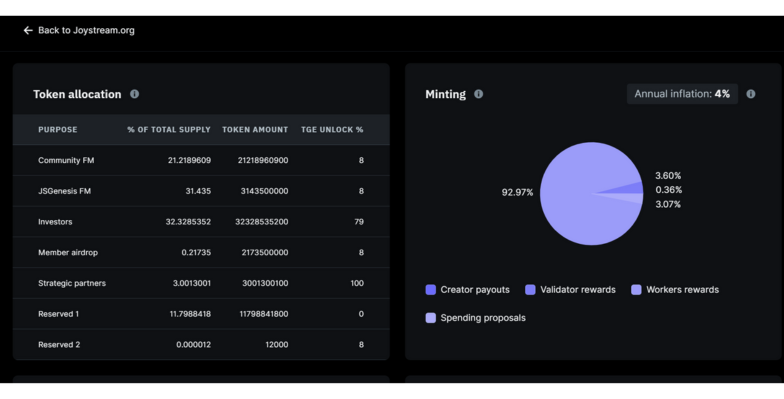
Interactive Pie Chart
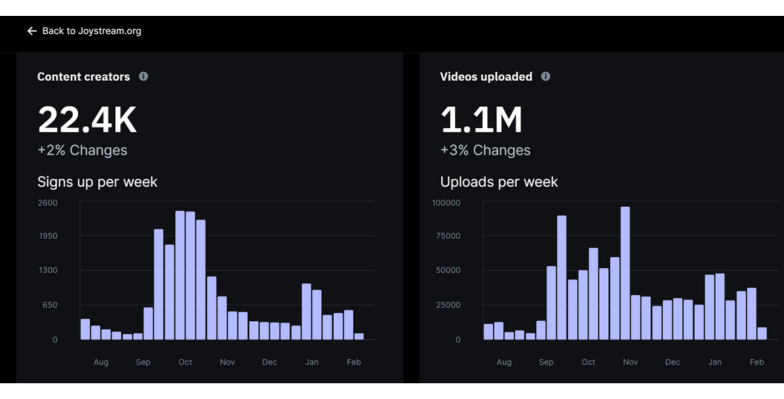
Reusable Bar Chart Widget
Contact Us